EMEA +44 (0) 207 381 7840 USA +1 702 783 3360 ASIA +81 3 5846 8842 [email protected]
0%

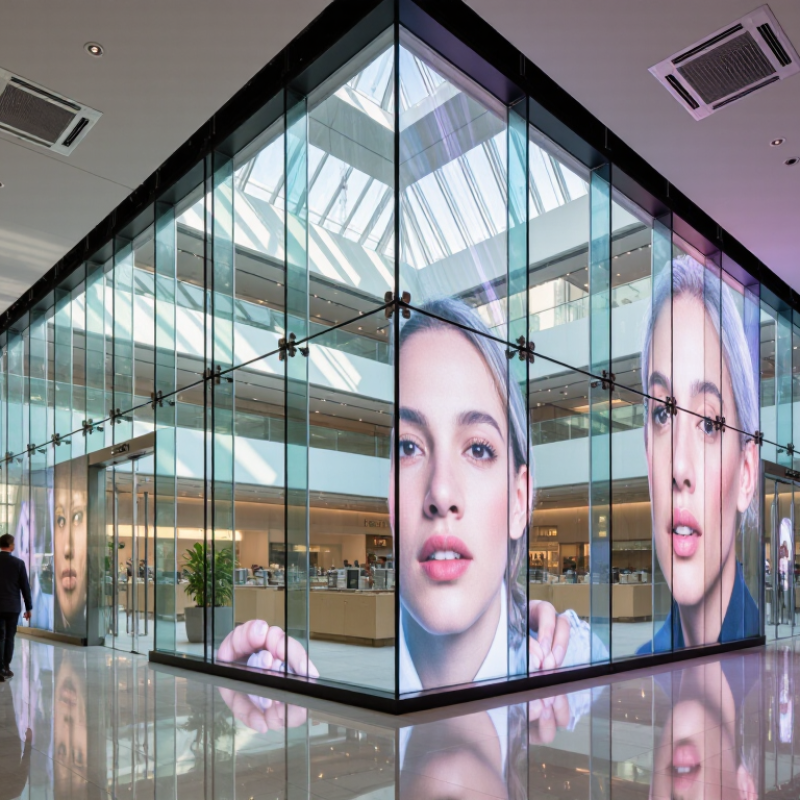
Transparent LED video walls are reshaping retail storefronts, airports, museums, and corporate atriums in 2026. Their appeal is immediate: vivid motion appears across glass while daylight and interior views remain visible. That balance is useful, but it is not automatic. Panel structure, pixel pitch, brightness, viewing distance, and glass reflectivity can change the result dramatically.

This guide evaluates the 2026 best Transparent LED video walls for global buyers. It focuses on measurable performance, practical installation, and long-term service support. Key considerations include transparency rate, refresh rate, front or rear maintenance, power consumption, weather protection, and control-system compatibility. Certification documents matter too. Buyers should verify regional electrical requirements, fire-safety expectations, warranty terms, and available replacement modules before signing an order. A bright showroom sample proves little.

Field conditions often expose weaknesses. Direct afternoon sunlight can reduce contrast. Dust may collect around exposed connectors. Uneven glass framing can complicate alignment. Careful testing helps. Ask suppliers for installation drawings, calibrated demonstration videos, and references from comparable projects. Independent technical review is valuable when multiple vendors offer similar specifications.

No single wall suits every building. Higher transparency may reduce visual density, while tighter pixel pitch can increase cost and power demand. Some published figures also reflect ideal laboratory conditions, not busy streets or humid coastal sites. That deserves honest attention. The strongest choice combines verified specifications, experienced integration, dependable support, and content designed for transparent displays. This overview offers a practical starting point for making that decision with fewer surprises.
2026 Best Transparent LED Video Walls for Global Buyers

Transparent LED Wall Types: P2.6–P10 Pixel Pitch and 60–90% Transparency

Transparent LED video walls are moving from visual novelty to practical architectural media. For 2026 projects, pixel pitch remains the main buying decision. P2.6 delivers sharper close-up images in retail interiors and reception areas. P3.9 and P4.8 suit atriums, airports, and event spaces. P6–P10 models work better for distant viewing and larger façades. Smaller pitch usually increases LED density, processing demands, and cost.

Transparency changes the installation experience. A 60% transparent wall preserves more daylight and sightlines behind the screen. An 80–90% design can look lighter across glass entrances, showroom windows, and suspended displays. However, transparency is not a fixed visual guarantee. Test results can change with cabinet structure, viewing angle, ambient light, and content brightness. A specification sheet cannot show every condition.

According to MarketsandMarkets’ 2024 Digital Signage Market report, the sector may grow from about USD 27.1 billion in 2024 to USD 43.4 billion by 2029. This growth supports wider demand for flexible display formats, including transparent systems. Yet buyers should question headline figures. Field testing matters more than a laboratory percentage. Request a daylight demonstration, measure viewing distance, and inspect black-level performance. P2.6 can appear impressive from two meters, but P10 may be more sensible across a broad façade. The wrong pitch wastes budget. It can also weaken the architectural effect.

2026 Performance Benchmarks: 4,000–6,000 Nits and 3,840 Hz Refresh

Transparent LED video walls are moving beyond visual novelty. Global buyers now compare measurable output, not only pixel pitch or cabinet weight. Industry outlook data from AVIXA’s 2024 IOTA report shows continued investment in professional display systems across retail, hospitality, transport, and live events. These environments demand stable brightness under changing light.

For 2026 installations, 4,000–6,000 nits is becoming a practical benchmark for outdoor-facing glass and sunlit atriums. LEDinside’s 2024 market analysis highlights rising demand for fine-pitch, high-brightness display solutions. A 3,840 Hz refresh rate also supports cleaner camera footage and smoother motion. It matters during live broadcasts. However, brightness ratings need careful verification. Some specifications reflect maximum output, not calibrated operating performance.

Ask suppliers for measured brightness at standard color temperature, power consumption, and thermal conditions. Request camera tests at common shutter speeds, including 1/50 and 1/60 second. Check whether transparent areas create visible moiré across glass reflections. Small gaps can become distracting under direct sunlight. The Display Supply Chain Consultants’ 2024 large-display research also points to stronger demand for premium commercial visualization, but market growth does not guarantee equal product quality.

Experience suggests that a darker transparent structure can improve contrast, yet it may reduce perceived openness. That trade-off deserves a physical sample test. Do not rely on showroom lighting. Test the wall beside real windows, moving shadows, and nighttime reflections. 3840 Hz helps, but it cannot correct poor calibration, uneven modules, or unstable processing hardware.

2026 Transparent LED Video Wall Performance Benchmarks

Brightness benchmarks range from 4,000 to 6,000 nits, supporting visibility from indoor retail environments to high-ambient-light outdoor installations. A 3,840 Hz refresh rate is used as the reference benchmark for smooth motion, camera-friendly capture, and reduced scan-line artifacts.

Energy and ROI Metrics: LED Power Use Versus LCD Video Walls

2026 Best Transparent LED Video Walls for Global Buyers

Energy performance deserves more attention than visual novelty. Transparent LED walls often consume about 180–450 watts per square meter, depending on brightness, pixel pitch, and content. Commercial LCD video walls commonly use 250–600 watts per square meter during operation. These ranges are indicative, not universal. Actual readings can change sharply during daylight.

The International Energy Agency’s Electricity 2024 report highlights rising global cooling and display-related electricity demand. The U.S. Department of Energy also reports that modern LED systems can deliver over 100 lumens per watt in suitable applications. However, display efficiency is not identical to lighting efficiency. A bright storefront wall may consume more energy than expected. Measure it.

For ROI, buyers should record watts, operating hours, electricity tariffs, maintenance visits, and replacement cycles. A transparent wall running 12 hours daily at 300 watts per square meter uses roughly 1,314 kilowatt-hours yearly per square meter. At $0.15 per kilowatt-hour, energy costs reach about $197 annually. LCD panels may appear cheaper initially, but bezels, cooling, and frequent panel replacement can weaken that advantage. Transparent LED can preserve window visibility and advertising value, which is difficult to price precisely. That is the uncomfortable part. A spreadsheet may look accurate while ignoring brightness changes, content density, and seasonal tariffs. IEC 62087 measurement methods improve comparison, but field testing remains essential.

2026 Best Transparent LED Video Walls for Global Buyers - Energy and ROI Metrics: LED Power Use Versus LCD Video Walls
Metric Transparent LED Video Wall LCD Video Wall Calculation Basis or Buyer Relevance
Normalized Comparison Scenario
Reference wall size 20 m² 20 m² The same active display area is used for an equal comparison.
Daily operating schedule 12 hours per day 12 hours per day A common retail, transportation, hospitality, and commercial-display schedule.
Operating days per year 365 days 365 days Annual energy calculations assume continuous year-round operation.
Electricity price used for modeling US$0.15 per kWh US$0.15 per kWh Replace this value with the buyer’s local commercial electricity tariff.
Energy and Electrical Performance
Typical operating power 180 W/m² 320 W/m² Representative planning values for normal video content and regulated brightness; actual power varies by model, brightness, refresh rate, and content.
Estimated total operating load for 20 m² 3.60 kW 6.40 kW Formula: display area × typical operating power.
Estimated annual electricity consumption 15,768 kWh/year 28,032 kWh/year Formula: operating load × 12 hours × 365 days.
Estimated annual electricity cost US$2,365/year US$4,205/year Formula: annual kWh × US$0.15 per kWh; excludes HVAC, installation, and maintenance.
Annual energy-cost difference Baseline Approximately US$1,840 higher Modeled difference between the two normalized operating loads.
Modeled energy-cost reduction Approximately 43.8% versus LCD Baseline Formula: (LCD annual cost − transparent LED annual cost) ÷ LCD annual cost.
Estimated ten-year electricity cost US$23,652 US$42,048 Assumes constant operating hours and electricity pricing; inflation and tariff changes are excluded.
Ten-year modeled energy-cost saving Approximately US$18,396 Baseline Energy-only comparison before capital cost, maintenance, financing, and replacement costs.
Display and Installation Characteristics
Typical transparency range Approximately 60%–90% 0% transparency Transparency depends on LED spacing, cabinet structure, viewing angle, and content brightness.
Typical brightness range Approximately 3,000–7,000 nits Approximately 500–1,500 nits Outdoor-facing installations generally require higher brightness than indoor applications.
Common pixel-pitch range Approximately 3.9–10 mm Approximately 0.9–3.5 mm bezel-to-bezel Pixel pitch and viewing distance should be selected together; LCD terminology refers to panel seam width.
Typical module or panel serviceability Individual LED modules or bars can usually be replaced A failed panel is commonly replaced as a complete unit Actual service method depends on the cabinet, mounting system, and spare-parts policy.
Typical rated operating life Approximately 80,000–100,000 hours Approximately 50,000–60,000 hours Rated life is not a guarantee of uniform brightness or color performance throughout the period.
Cooling requirement Passive airflow is common; forced cooling may be required at high brightness Heat removal is required behind each panel and through the mounting structure Actual HVAC impact depends on enclosure design, room volume, ambient temperature, and installation density.
ROI and Buyer Decision Metrics
Energy-only annual operating saving US$1,840 per year in the reference scenario Not applicable This saving is valid only when both displays operate at the stated load, schedule, and electricity price.
Energy-only payback formula Additional transparent LED investment ÷ US$1,840 annual energy saving Not applicable Do not claim a payback period without a project-specific purchase, installation, maintenance, and replacement quotation.
Revenue opportunity Can preserve window visibility while displaying advertisements or information Creates a solid digital surface and may block views or daylight Potential revenue depends on audience traffic, advertising rates, occupancy, content policy, and local regulations.
Best-fit applications Glass façades, retail windows, airports, museums, hospitality venues, and architectural installations Control rooms, meeting spaces, indoor signage, broadcast environments, and close-viewing applications Application suitability should be evaluated against viewing distance, ambient light, weather exposure, and required image detail.
Primary energy risk High brightness settings can substantially increase power use Large wall areas and continuous backlight operation can increase power use Use automatic brightness control and content scheduling to reduce unnecessary energy consumption.
Primary commercial risk Higher initial cost may require advertising or visibility benefits to achieve full ROI Lower initial cost may be offset by panel replacement, bezel visibility, and limited transparency A complete ROI model should include capex, installation, maintenance, content revenue, energy, downtime, and resale value.
Data note: The figures above are engineering planning benchmarks based on commonly published operating ranges for commercial transparent LED and LCD video-wall systems. They are not manufacturer-specific specifications or quotations. Final purchasing decisions should use measured power data at the required brightness, local electricity tariffs, project dimensions, operating schedule, warranty terms, and installation conditions.

Global Compliance Standards: CE, UL, FCC, IP Ratings, and 50,000-Hour Life

For global buyers, transparent LED video walls need more than bright visuals. CE marking indicates conformity with applicable European safety, EMC, and environmental requirements. It is not a universal quality certificate. UL evaluation can support electrical safety in North American installations, while FCC Part 15 addresses unwanted radio-frequency emissions. These checks matter near wireless equipment, retail sensors, and public information systems.

IP ratings follow IEC 60529. IP65, for example, limits dust entry and resists water jets, but it does not prove protection against salt, condensation, or pressure washing. Installation records should show cable sealing, grounding, ventilation, and temperature control. A 2024 report from MarketsandMarkets places the global LED display market on a strong growth path, increasing the need for consistent compliance documentation. Market expansion does not remove site-specific risks.

Many specifications promise 50,000 hours of service. At ten operating hours daily, that equals roughly 13.7 years, but usually before significant brightness depreciation. Heat, high drive current, dust, and poor power quality can shorten that figure. Field experience shows that module uniformity often fails before the advertised lifetime ends. Buyers should request LM-80 or equivalent LED data, test conditions, replacement procedures, and measured brightness retention. I would also question certificates with mismatched model numbers. Small paperwork errors become expensive during customs clearance or final inspection.

Best 2026 Applications: Retail, Architecture, Events, and Broadcast Systems

2026 Best Transparent LED Video Walls for Global Buyers

Transparent LED video walls are changing retail, architecture, events, and broadcast systems in practical ways. In retail, they cover storefront glass while preserving daylight and street visibility. Content should use strong contrast, large typography, and slower movement. Small text often disappears behind reflections. A transparent wall is not invisible.

Architectural projects require early checks for weight, ventilation, access, and viewing distance. Designers should coordinate mounting points with structural engineers, especially on glass facades. At events, lightweight panels can create dramatic stage layers, entrance tunnels, or sponsor displays. However, transport cases, spare modules, weather protection, and safe rigging need real planning. One missed detail can delay installation.

Broadcast systems demand stricter testing. Camera teams should check moire, refresh behavior, brightness, color consistency, and scan performance before recording. Calibrated content helps prevent distracting flicker or uneven shades. Results vary between camera models, so one test is rarely enough.

Tips: Measure brightness at the actual site, not only in a showroom. Request pixel-level calibration data and service procedures. Confirm regional electrical, fire, and structural requirements with qualified professionals. Keep ventilation paths clear. Also, allow time for revisions; the first content layout may look impressive but perform poorly under changing daylight.

FAQS

What brightness level suits a transparent LED wall in 2026?

Aim for 4,000–6,000 nits near outdoor-facing glass or sunlit atriums. Peak brightness can mislead. Request calibrated operating measurements under realistic thermal conditions.

Why does a 3,840 Hz refresh rate matter?

It can produce smoother motion and cleaner camera footage during live broadcasts. However, refresh rate cannot fix poor calibration or unstable processing. Test before purchase.

How should buyers verify display performance?

Request brightness, power, and thermal readings at a standard color temperature. Ask for camera tests at 1/50 and 1/60 second shutter speeds. Check reflections carefully.

How much electricity does transparent LED use?

Typical consumption ranges from 180–450 watts per square meter. Brightness, pixel pitch, and content affect the actual reading. Measure it onsite.

What might annual energy costs look like?

A one-square-meter wall using 300 watts for 12 hours daily consumes about 1,314 kilowatt-hours yearly. At $0.15 per kilowatt-hour, that costs roughly $197 annually. Real tariffs vary.

Can transparent LED offer better value than LCD video walls?

It may preserve window visibility while displaying advertising or information. LCD systems may cost less initially. Bezels, cooling, and replacement panels can change the calculation.The spreadsheet is not perfect.

Which environments suit transparent LED video walls?

Retail storefronts, architectural glass, event stages, entrance tunnels, and broadcast sets are common applications. Use strong contrast and large lettering. Small text often disappears behind reflections.

What should architects check before installation?

Confirm weight, mounting points, ventilation, viewing distance, and service access. Coordinate facade work with qualified structural professionals. Leave clear airflow paths.

How can event and broadcast users reduce problems?

Plan transport cases, spare modules, weather protection, and safe rigging. Broadcast teams should test moiré, flicker, color consistency, and scan behavior. One camera test is insufficient.

Should buyers trust showroom demonstrations?

No. Test beside real windows, moving shadows, and nighttime reflections. A darker structure may improve contrast but reduce perceived openness. Physical samples reveal that trade-off.

Conclusion

Transparent LED video walls are becoming a leading display solution for global buyers in 2026, combining strong visual performance with a see-through design. Available in pixel pitches from P2.6 to P10, these systems can provide approximately 60–90% transparency, allowing natural light, architectural features, and interior layouts to remain visible. Key performance benchmarks include 4,000–6,000 nits of brightness and refresh rates up to 3,840 Hz, supporting clear images in bright environments and smooth video capture for professional production.

Compared with traditional LCD video walls, transparent LED technology can offer greater flexibility, lower structural impact, and competitive long-term energy and ROI performance when properly configured. Buyers should also evaluate CE, UL, FCC, and suitable IP ratings, along with an expected service life of around 50,000 hours. In 2026, the most promising applications include retail storefronts, architectural façades, exhibitions, live events, transportation spaces, and broadcast systems where visibility, creative presentation, and reliable operation are essential.

Alexander

Alexander

Alexander is a professional marketing specialist with extensive knowledge of the company’s products, services, and market environment. Through a combination of strategic thinking, customer-focused communication, and practical industry experience, he helps present complex product information in a......